 Grepster
Fast web server access log analysis: line-by-line streaming ingestion, pre-aggregated queries, visual trends and actionable insights.
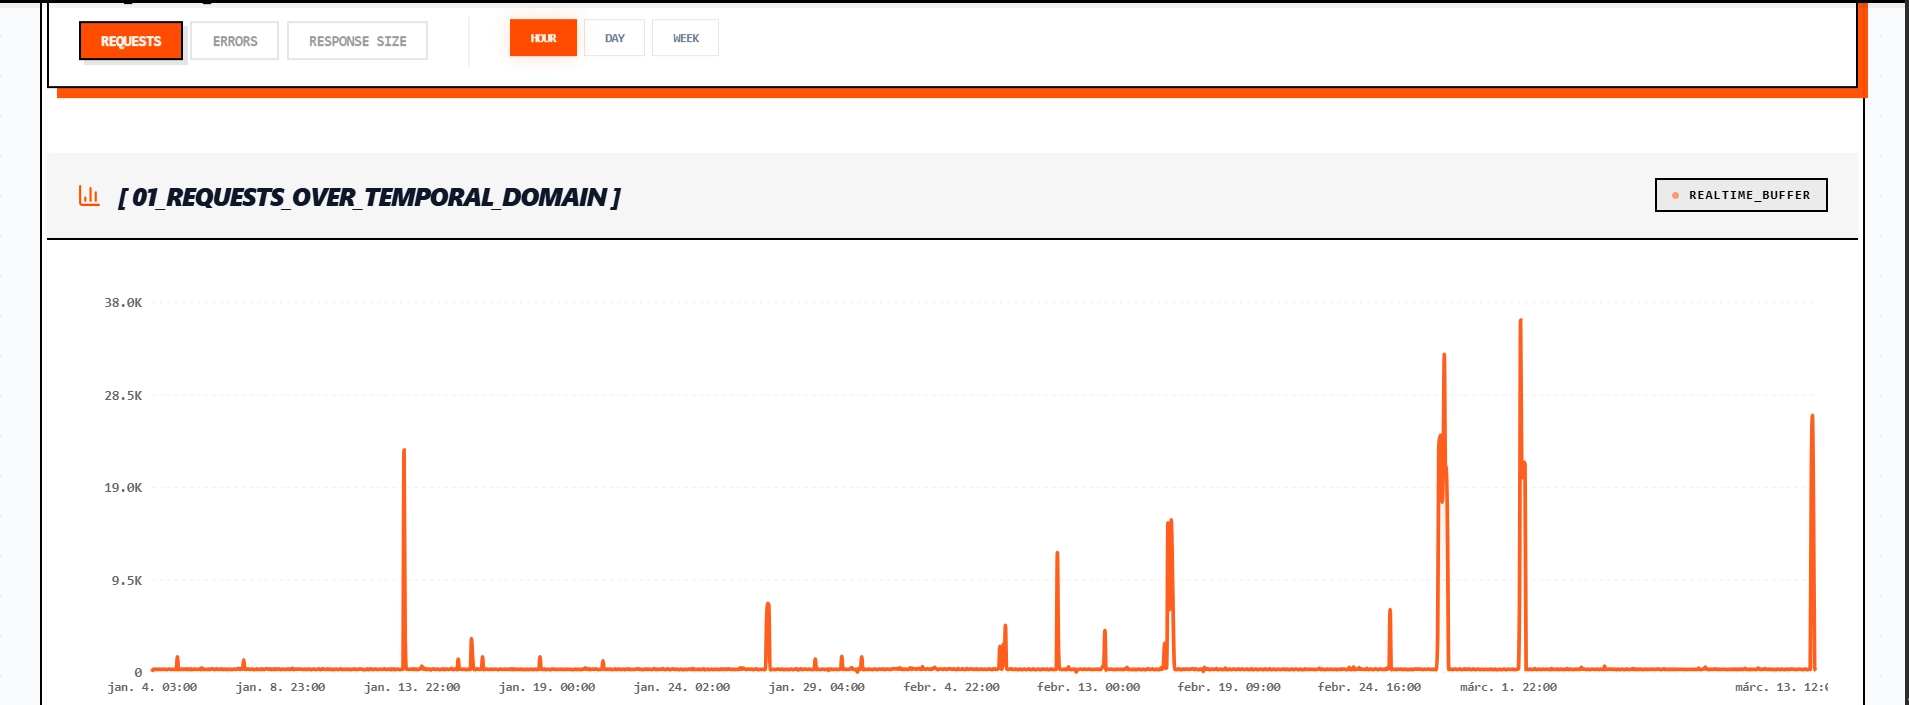
Web server logs contain a wealth of information, but traditional grep cannot help you see the patterns. Grepster gives you visual insight into traffic trends, anomalies and suspicious IP addresses, so you catch attack indicators that grepping raw logs would miss.
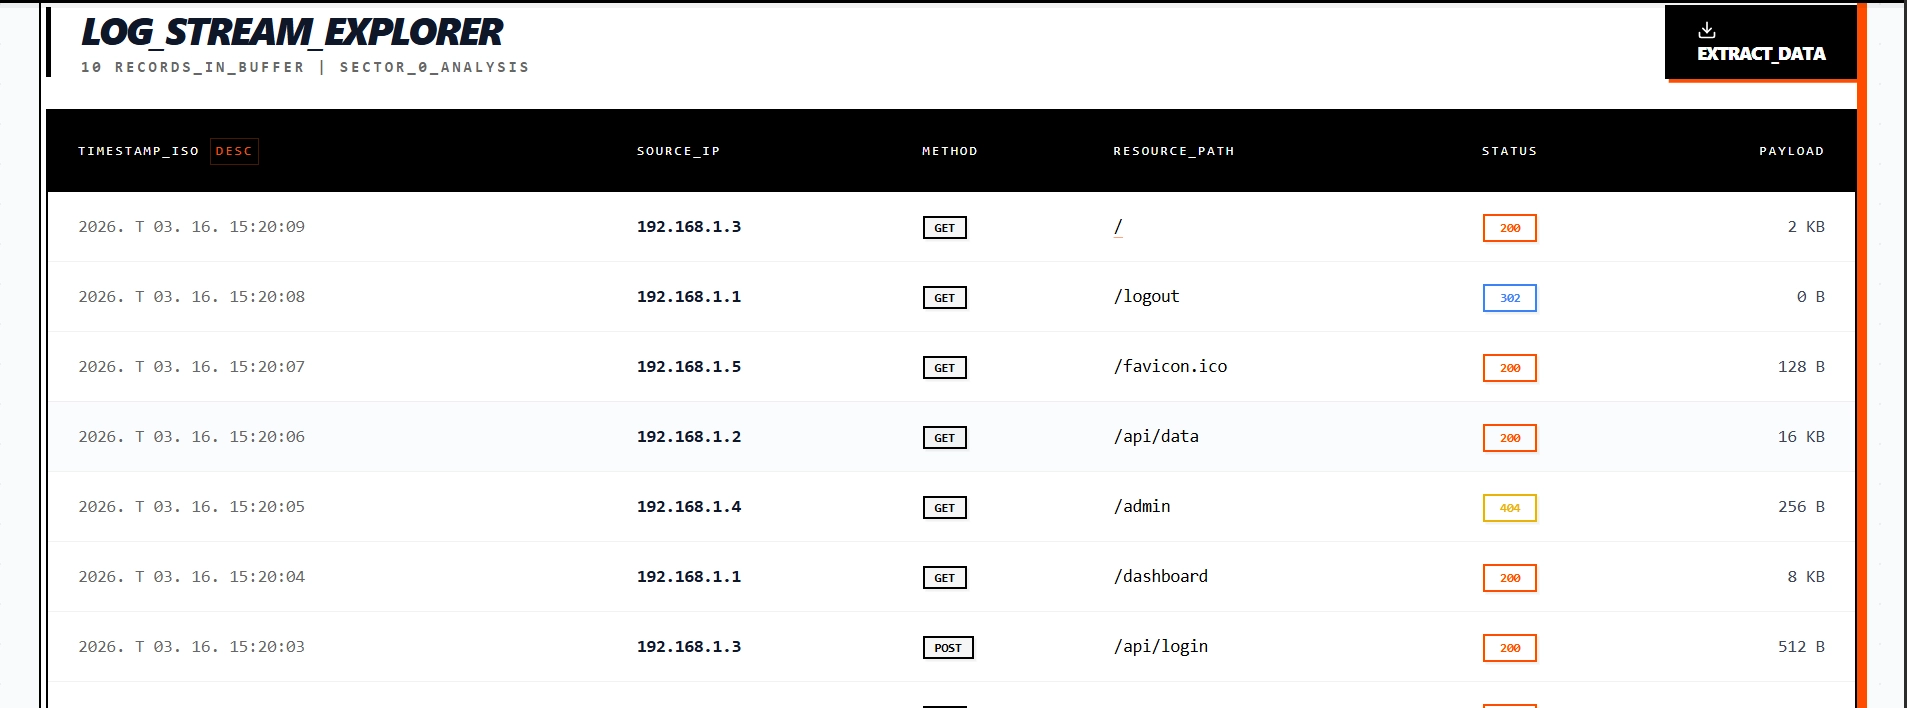
Drop in your Apache, Nginx, Tomcat, IIS or HAProxy logs: the format is detected automatically, with nothing to configure.
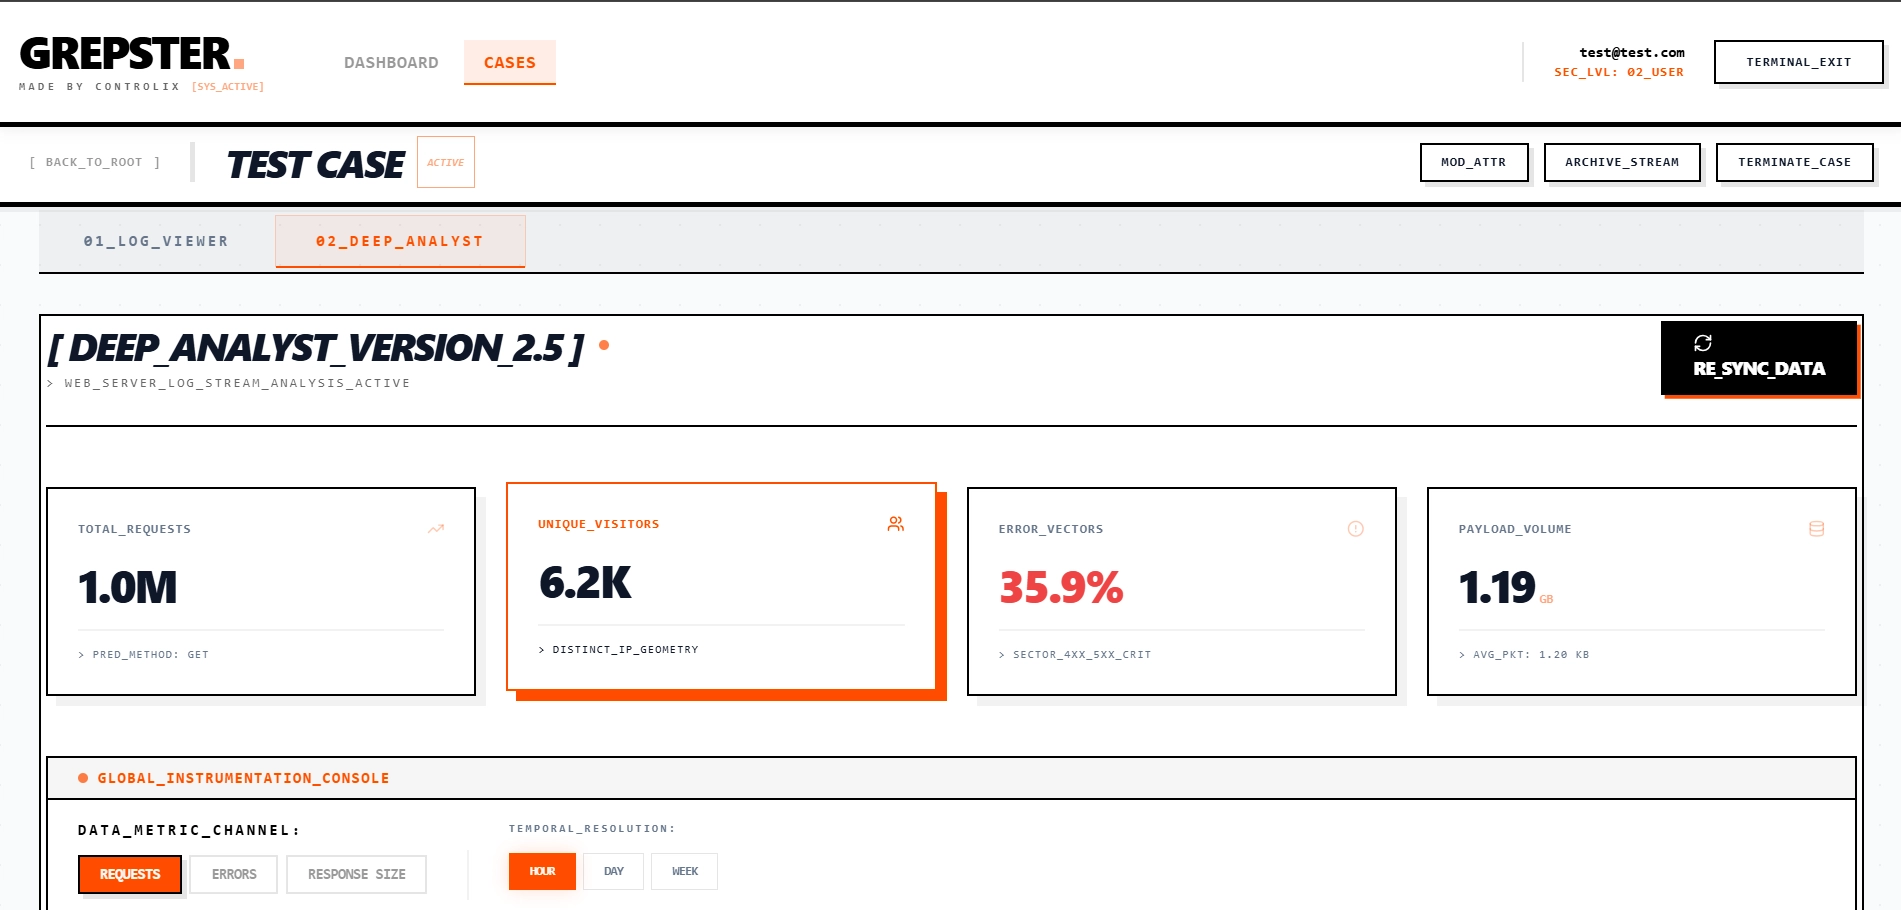
A streaming TypeScript parser processes files line by line without loading them into memory, and ClickHouse stores the data. The dashboard answers from pre-aggregated tables: for a one-week filter on a database of over 12 million rows it reads four thousand rows instead of 392,000.
Key features
- Streaming TypeScript parser. Files are processed line by line, never loaded into memory, in independently scalable worker containers.
- ClickHouse analytics database. Columnar OLAP storage and pre-aggregated rollup tables, so the dashboard reads a fraction of the rows.
- Zero configuration. Apache, Nginx, Tomcat, IIS, HAProxy, AWS ALB, Caddy, Squid, syslog, JSON and more are recognized automatically.
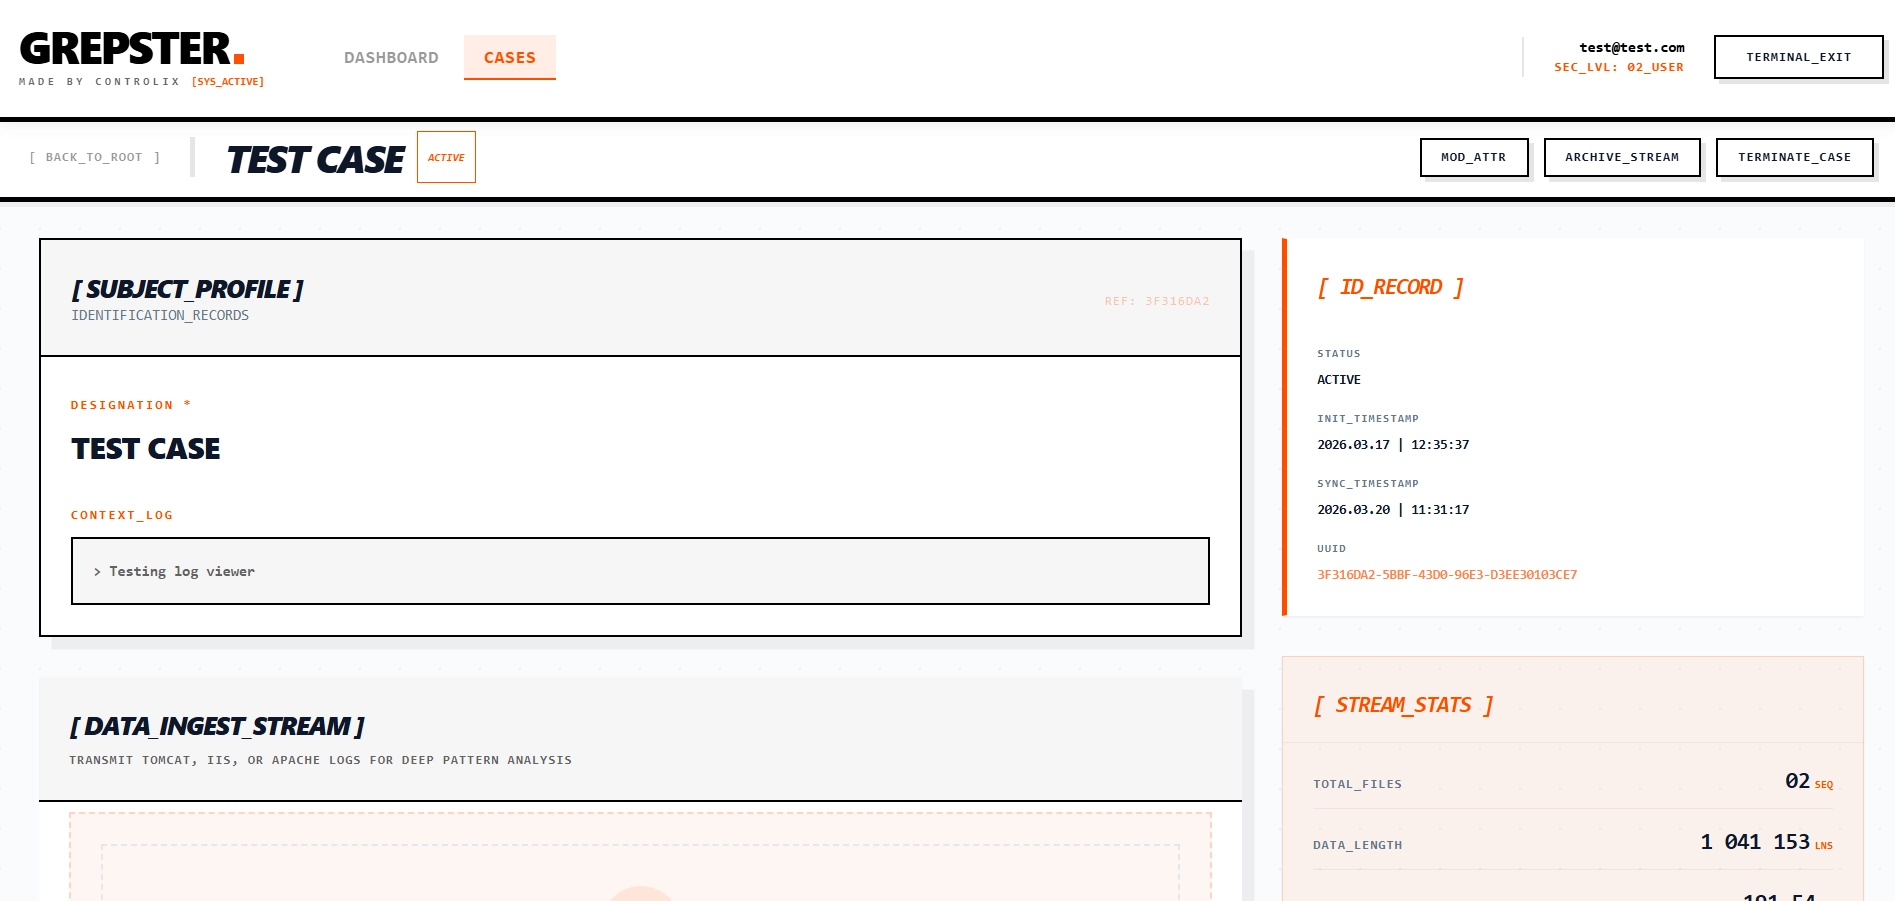
- Case-based management. Logs are organized into projects, and a case can be shared with colleagues as analyst or viewer.
- Built-in threat detection. SQL injection, XSS, path traversal, known scanners (sqlmap, nikto, nmap) and suspected brute force.
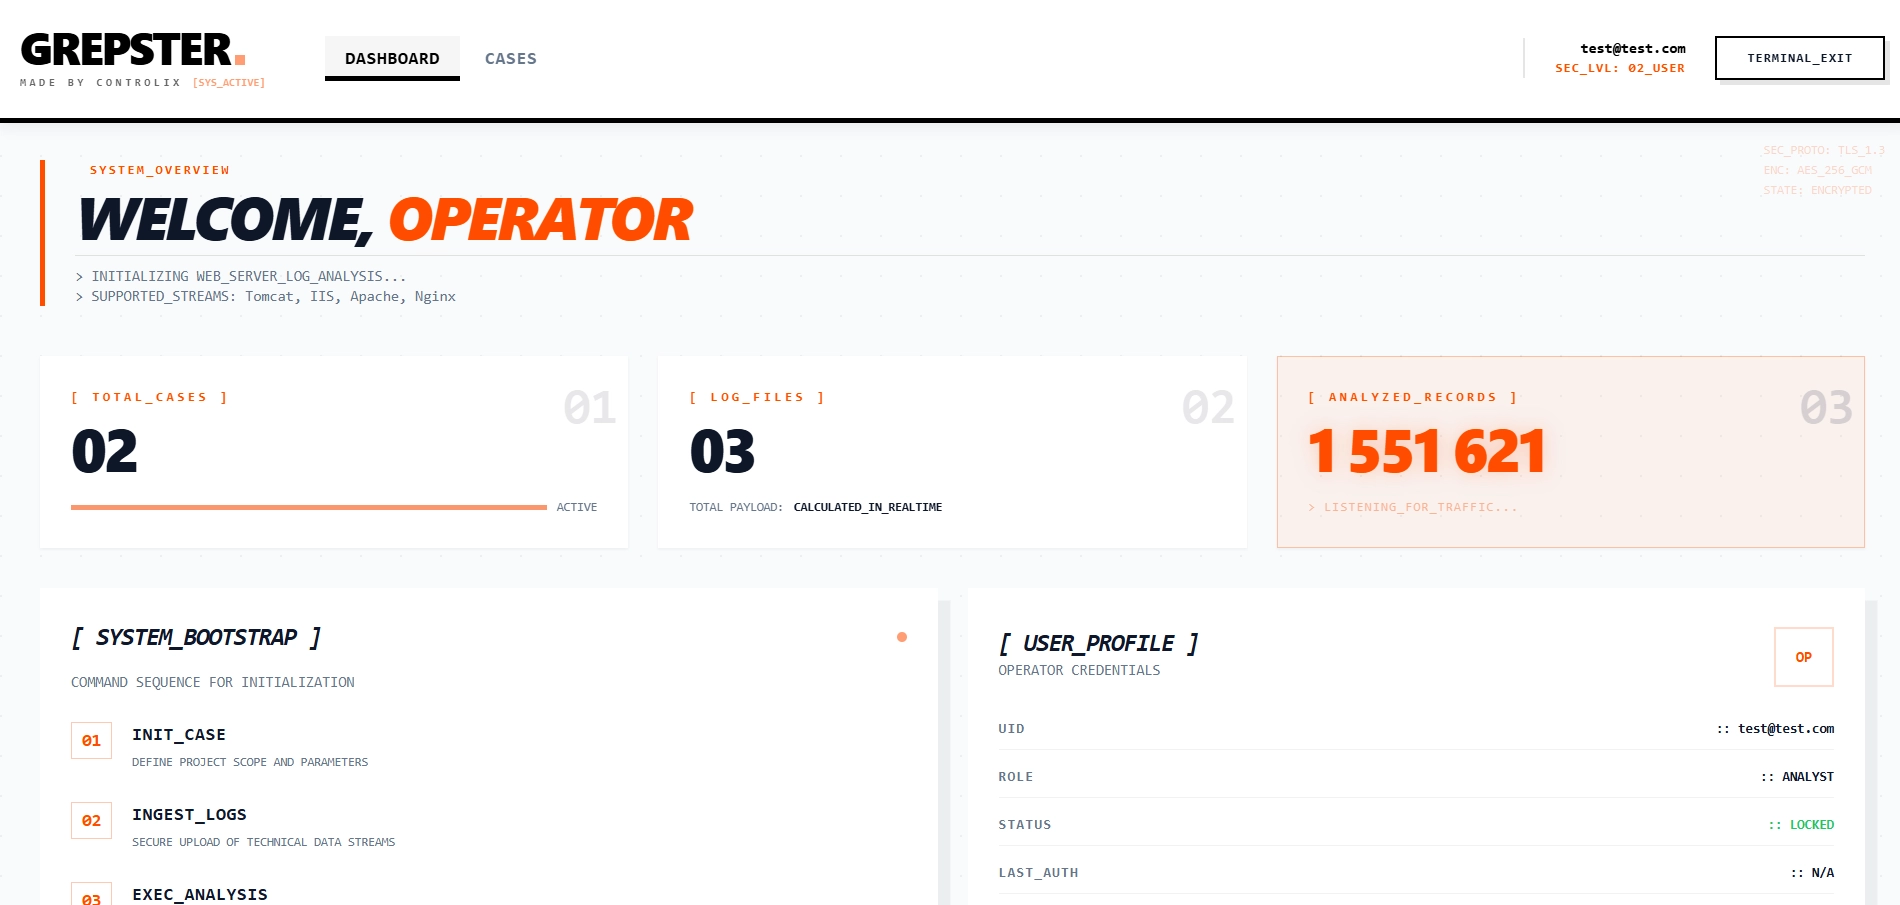
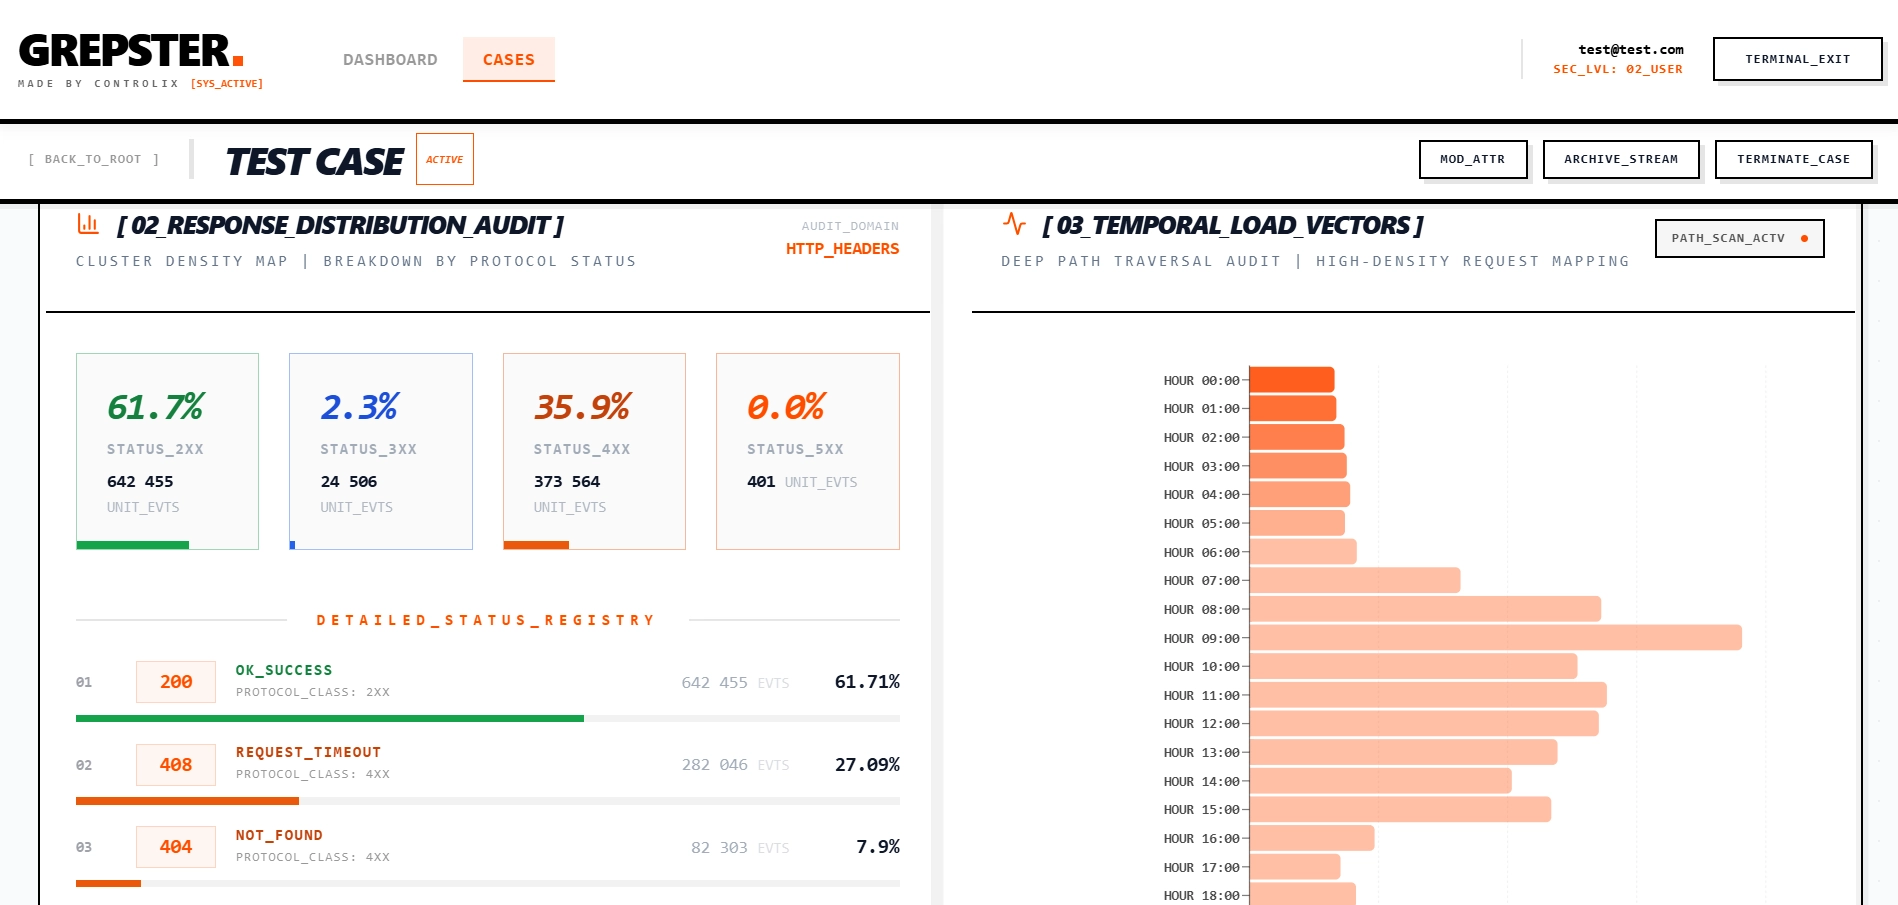
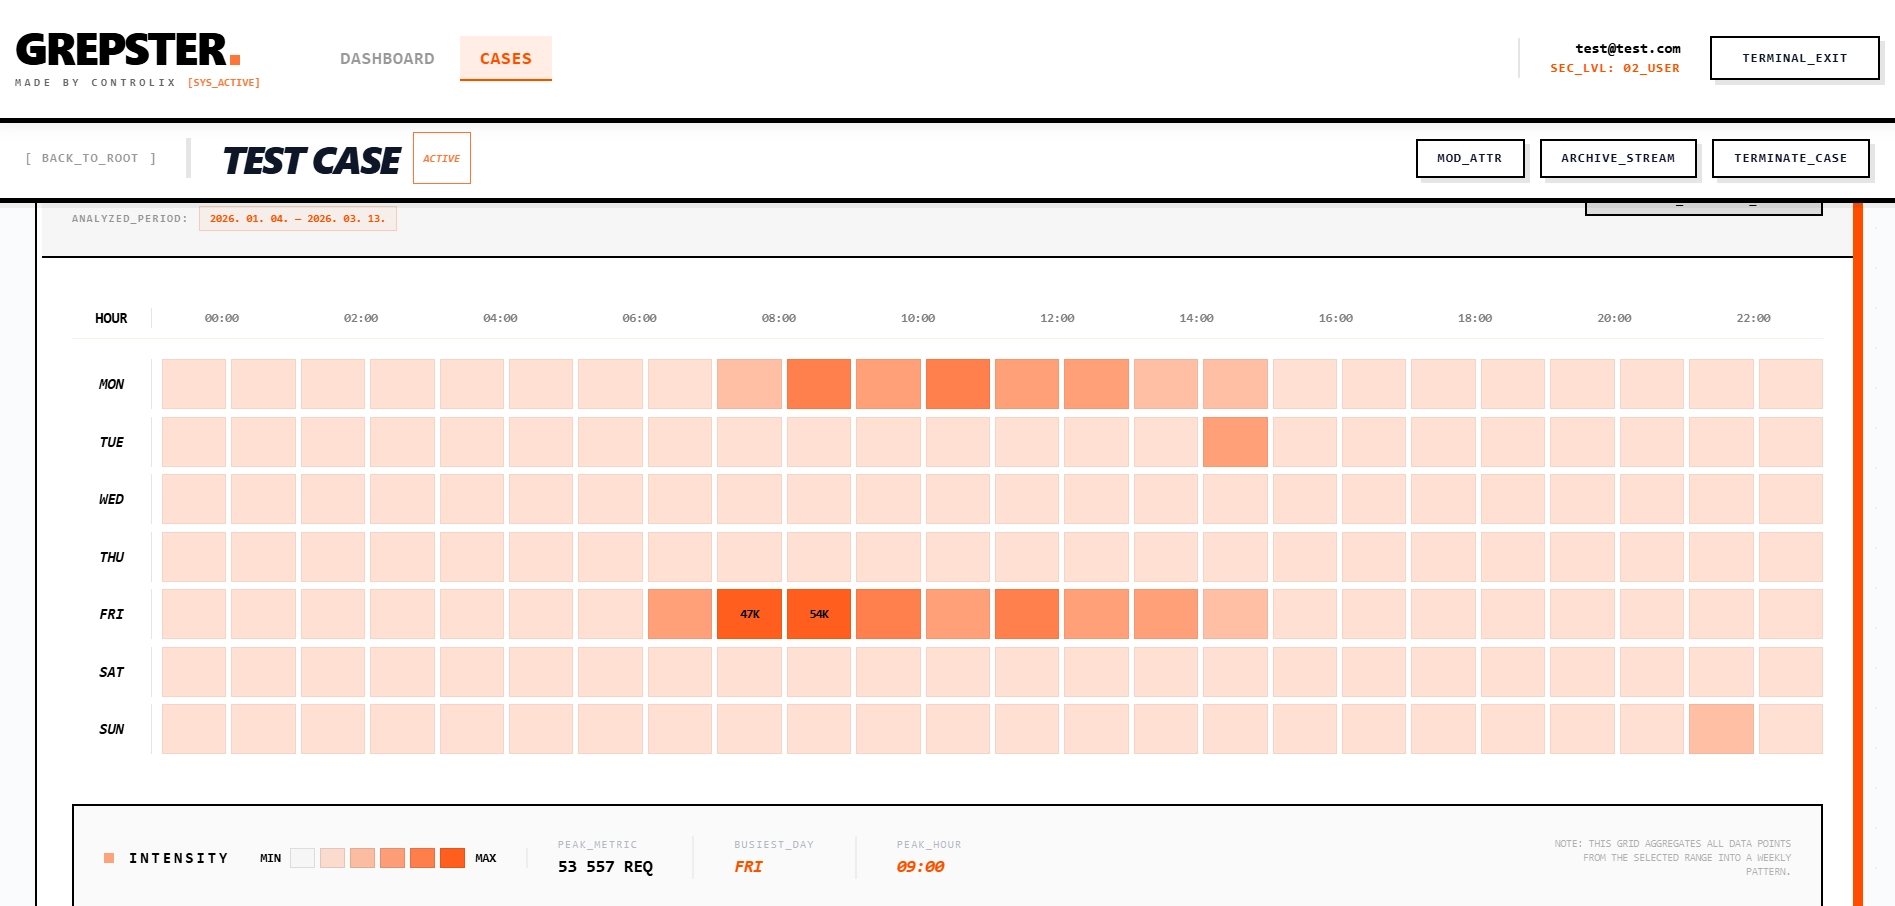
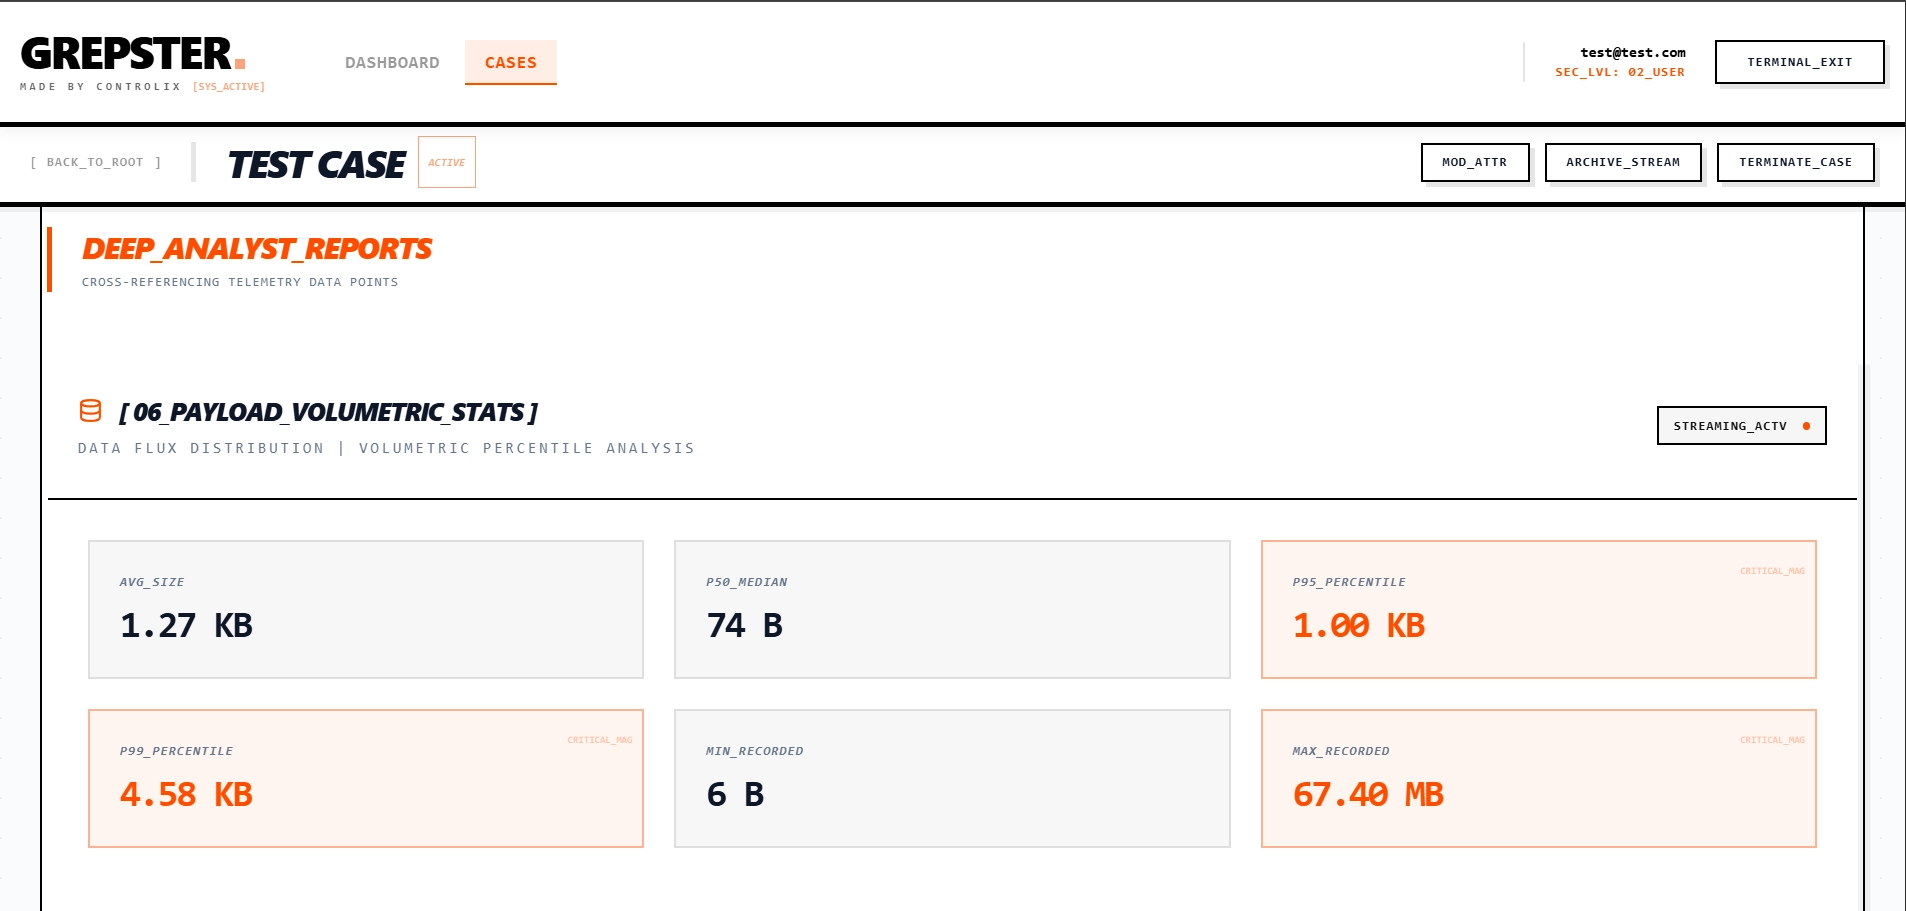
- Apache ECharts visualization. An interactive dashboard of traffic trends, failed requests and security alerts.
- IP and path analysis. Suspicious addresses, most visited pages, failed requests, status codes, a GeoIP world map and country ranking.
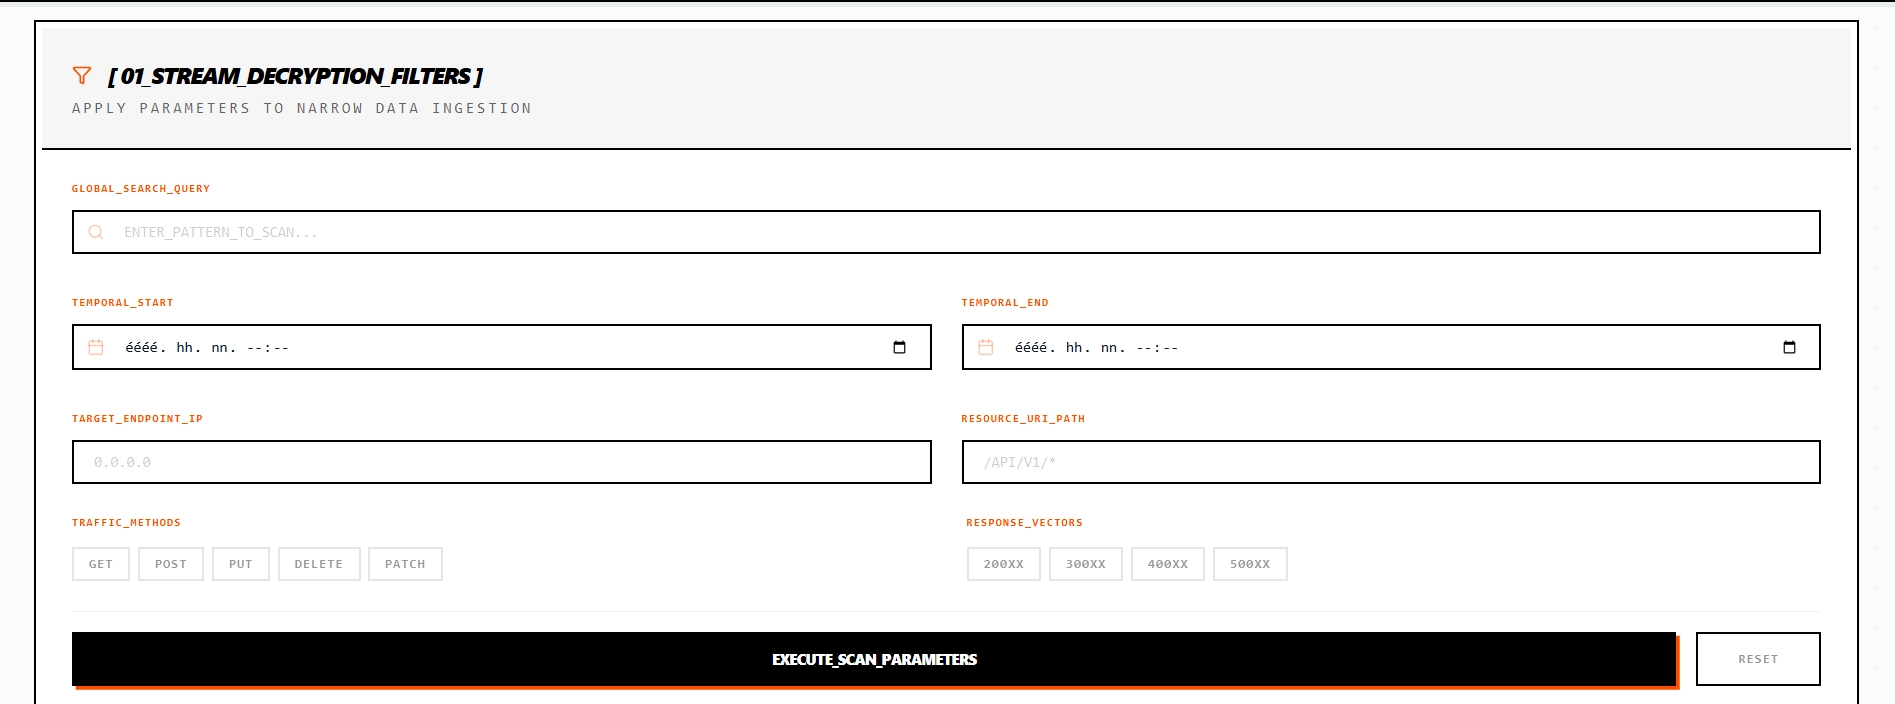
- Regex search and export. Pattern search in ClickHouse, multi-dimensional filters, streamed export of results as CSV, JSON and JSONL.
- BullMQ and Redis background processing. A reliable job queue, with parse progress pushed live over Server-Sent Events.
- Docker-based, production-ready architecture. API, worker, UI, databases and Prometheus metrics in a single stack.
> SCREENSHOTS
What it looks like in practice